The context of the canvas element provides a number of properties that can be used to customize how the canvas is rendered. Such properties include the following:
- strokeStyle : Sets the color of the lines or the color of the outline. The default color is black
- fillStyle : Sets the fill color of shapes. The default color is black
- lineWidth : sets the width of the lines. Default is 1.0
- lineJoin : sets the line join style
- globalAlpha : sets the transparency of the rendering on the canvas
- setLineDash : creates a line from short dashes
In the previous topic, when drawing rectangles, we did not explicitly set any colors, so the default color, black, was used for the color of the lines and the fill of the rectangles. Now let’s use other colors:
To draw some visible shapes, we need to set a color. You can set the color in different ways. First, we can set the color of the outline or border of shapes using the strokeStyle property :
<!DOCTYPE html>
<html lang="en">

<head>
    <meta charset="UTF-8">
    <meta http-equiv="X-UA-Compatible" content="IE=edge">
    <meta name="viewport" content="width=device-width, initial-scale=1.0">
    <title>Canvas in HTML5</title>
</head>

<body>
    <canvas id="myCanvas" width="350" height="200" style="background-color:#eee; border: 1px solid #ccc;">
        Your browser does not support Canvas
    </canvas>
    <script>
        var canvas = document.getElementById("myCanvas"),
            context = canvas.getContext("2d");

        context.strokeStyle = "red";
        context.fillStyle = "blue";

        context.strokeRect(50, 40, 100, 100);
        context.fillRect(200, 40, 100, 100);
    </script>
</body>

</html>
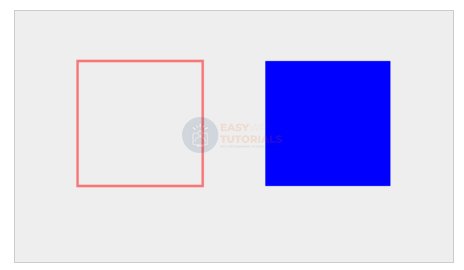
Get the name of the color as a string, either as a hexadecimal color value (for example, “# 00FFFF “), strokeStyleor fillStyleas rgb values (“rgb(0, 0, 255)”) and rgba (“rgba( 0, 0, 255, 0.5)”).
The property lineWidthallows you to set the line thickness:
var canvas = document.getElementById(“myCanvas”),
context = canvas.getContext(“2d”);
context.strokeStyle = “red”;
context.fillStyle = “blue”;
context.lineWidth = 6.5;
context.strokeRect(50, 40, 100, 100);
context.fillRect(50, 40, 100, 100);

setLineDash
The method setLineDash()takes as a parameter an array of numbers that set the distance between the lines. For example:
<!DOCTYPE html>
<html lang="en">

<head>
    <meta charset="UTF-8">
    <meta http-equiv="X-UA-Compatible" content="IE=edge">
    <meta name="viewport" content="width=device-width, initial-scale=1.0">
    <title>Canvas in HTML5</title>
    </head>
    <body>
        <canvas id="myCanvas" width="450" height="200"
                style="background-color:#eee; border: 1px solid #ccc;">
            Your browser does not support Canvas
        </canvas>
        <script>
            var canvas = document.getElementById("myCanvas"),
                context = canvas.getContext("2d");

            context.strokeStyle = "red";

            context.setLineDash([15,5]);
            context.strokeRect(40, 40, 100, 100);

            context.strokeStyle = "blue";
            context.setLineDash([2,5,6]);
            context.strokeRect(180, 40, 100, 100);

            context.strokeStyle = "green";
            context.setLineDash([2]);
            context.strokeRect(320, 40, 100, 100);
        </script>
    </body>
</html>

Line connection type
The property lineJoinis responsible for the type of connection of lines in the figure. It can take the following values:
- miter: straight joints that form right angles. This is the default
- round: rounded connections
- bevel: conical connections
<!DOCTYPE html>
<html lang="en">

<head>
    <meta charset="UTF-8">
    <meta http-equiv="X-UA-Compatible" content="IE=edge">
    <meta name="viewport" content="width=device-width, initial-scale=1.0">
    <title>Canvas in HTML5</title>
    </head>
    <body>
        <canvas id="myCanvas" width="450" height="200"
                style="background-color:#eee; border: 1px solid #ccc;">
            Your browser does not support Canvas
        </canvas>
        <script>
            var canvas = document.getElementById("myCanvas"),
                context = canvas.getContext("2d");

            context.strokeStyle = "red";
            context.fillStyle = "blue";

            context.lineWidth = 15;
            context.lineJoin = "miter";
            context.strokeRect(40, 40, 100, 100);
            context.lineJoin = "bevel";
            context.strokeRect(180, 40, 100, 100);
            context.lineJoin = "round";
            context.strokeRect(310, 40, 100, 100);
        </script>
    </body>
</html>

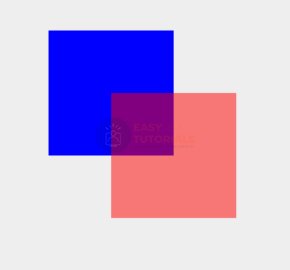
Transparency
The property globalAlphasets the rendering transparency. It can take as its value a number between 0 (fully transparent) and 1.0 (not transparent):
<!DOCTYPE html>
<html lang="en">

<head>
    <meta charset="UTF-8">
    <meta http-equiv="X-UA-Compatible" content="IE=edge">
    <meta name="viewport" content="width=device-width, initial-scale=1.0">
    <title>Canvas in HTML5</title>
</head>

<body>
    <canvas id="myCanvas" width="450" height="300" style="background-color:#eee; border: 1px solid #ccc;">
        Your browser does not support Canvas
    </canvas>
    <script>
        var canvas = document.getElementById("myCanvas"),
            context = canvas.getContext("2d");

        context.fillStyle = "blue";
        context.fillRect(50, 50, 100, 100);

        context.globalAlpha = 0.5;
        context.fillStyle = "red";
        context.fillRect(100, 100, 100, 100);
    </script>
</body>

</html>
Here, two rectangles are displayed on the canvas: blue and red. But before the red rectangle is drawn, the rendering semi-transparency is set, so we can see the blue through the red rectangle: